Disclosure: Our content isn't financial advice. Do your due diligence and speak to your financial advisor before making any investment decision. We may earn money from products reviewed. (Learn more)
The accelerated growth of the U.S. tech sector has, by many accounts, created an unstable investment environment. Although the S&P 500 is led by U.S. tech stocks with long runways, there’s no guarantee that they can be trusted to keep your money safe in the short-run.
We’re witnessing the development of what many are calling a stock market bubble, led by what ex-Federal Reserve Chair Alan Greenspan calls “irrational exuberance” in the market. Starry-eyed investors have spiked the prices of assets beyond their fundamental values. In other words, we’ve created a speculative bubble.
This is especially true in the stock market. There’s no financial market more volatile than the U.S. equities market, and the events of the past year have proven as much. The CBOE Volatility Index (VIX) closed 2020 at 23%—1.28x higher than the historical average.
For many, the stock market feels like a ticking time bomb. But can we objectively and neutrally say whether we’re truly in a bubble? In this article, I’ve taken a stab at this question, and shed light on how you can build a bubble-resistant investment portfolio.
What Is An Asset Bubble?
An asset bubble describes an economic situation in which the price of something far exceeds its perceived underlying value. Although it’s difficult to pinpoint the intrinsic value of any asset, an inflated asset price can often be identified by runaway speculation.
Investors speculate on the future value of an asset, such as a security or a token, under the expectation that they should “buy low, sell high.” Sensibly, speculators purchase assets that they believe will rise in value over time, or sell those that they expect to fall.
Sounds reasonable enough. But when large groups of investors anticipate the value of an asset will rise, group psychology comes into play and creates incentives for others to follow suit (i.e., Fear of Missing Out, or FOMO).
When investors start experiencing FOMO because they anticipate that they might be absent from a winning investment opportunity, a snowball effect ensues. Eventually, broader market sentiment becomes rooted in the hype and hysteria surrounding the FOMO opportunity and, before long, speculators have driven the price of the asset far beyond what its fundamentals support.
Fundamental Analysis: The Basics
Here are a handful of the best metrics and quantitative measures that can act as valuable tools for determining the fundamental or intrinsic value of a company:
- Price/Earnings (P/E) Ratio: The price of a company’s stock relative to its annual net income per share, illustrating overall per-share investor demand. High P/E ratios (>15) indicate high demand and general bullish sentiment on the stock, signifying that investors are willing to “overpay” now to enjoy growth in the future.
- Price/Book (P/B) Ratio: The comparison of a company’s book value (i.e., net difference between total assets and liabilities) and their market capitalization. Arrived at by dividing the per-share stock price by the per-share book value. Lower P/B ratios under 1.0 indicate a potentially undervalued stock.
- Debt/Equity Ratio (D/E): The sum of a company’s liabilities divided by total shareholder equity, demonstrating the extent to which a company is financially sustained by debt versus internal funds. This metric is gradually falling out of favor due to ultra-low interest rate environments making borrowing more widespread.
- Free Cash Flow (FCF): A company’s FCF describes the cash leftover after considering all capital outflows required to sustain the business, or operating cash flow minus capital expenditures. High FCF signifies a company’s ability to pay down their debts, buy back stocks, and grow the business.
- Price/Earnings-to-Growth (PEG) Ratio: A company’s stock price to earnings ratio divided by the growth rate of its earnings over a defined period of time. Generally, a PEG ratio of 1.0 or lower indicates a potentially undervalued or fairly priced stock, whereas ratios above 2.0 typically signal that it’s overvalued.
Bear in mind that none of these fundamental analysis metrics in isolation tell the full story about the health of the market. All five must be considered together to help determine whether any individual stock might be valued above or below its intrinsic value.
Signs of a Stock Market Bubble
In aggregate, the U.S. equities market is up +80% since it nosedove during the early days of the pandemic last March. In that time, Tesla’s stock has octupled in value, making the company larger than the next ten automakers combined.
Mega-cap tech stocks, of which the five largest comprise 23% of the total value of the S&P 500, are valued far beyond their earnings. For instance, Shopify (SHOP) is currently trading with a P/E ratio of 267.8, nearly 10-times beyond the internet service sector average of 29.5. Similarly, Netflix (NFLX) has a P/E of 85.9, nearly three times the sectoral average.
These aren’t fringe companies. They combine for a market capitalization of over $350B between them, and are representative of a mega-cap tech sector whose valuations defy their fundamental metrics.
Overvaluation isn’t limited to the tech sector, either. Colgate-Palmolive (CL), a $67B consumer products company, has a debt-equity ratio of 10.2. Theirs is about seven times higher than the market-wide D/E average of 1.5.
The same goes for the S&P Composite in its entirety. As depicted in the chart below, the bundled geometric average of four prominent market indicators (P/E, cyclical P/E, Q, and regression trendline) was 176% as of February 28. This is the highest in the index’s history, which signals a bearish long-term outlook and the need for guarded expectations.
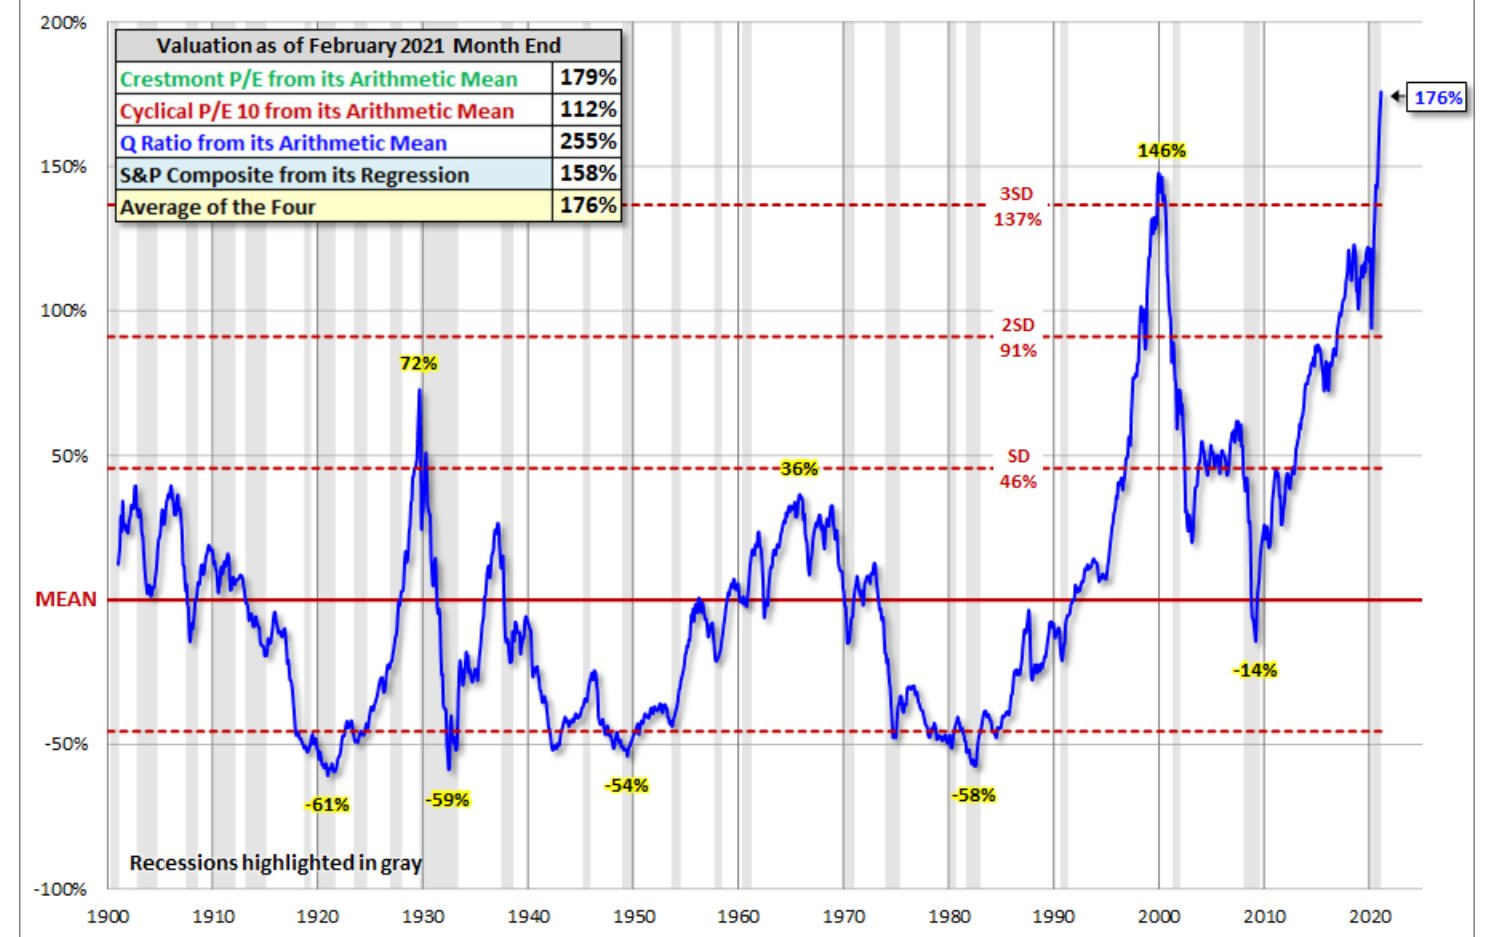
Source: Advisor Perspectives
Other Economic Indices
Today, billionaire investor and fund manager Ray Dalio’s proprietary indicator of market sentiment now stands at the 77th percentile, the highest level since the dotcom crash breached the 100th percentile mark. He further demonstrates that roughly 5% of the top 1,000 publicly-traded U.S. companies (i.e., Russell 1000) are valued in what he deems to be “bubble territory”, which is about half that of the peak of the dotcom bubble.
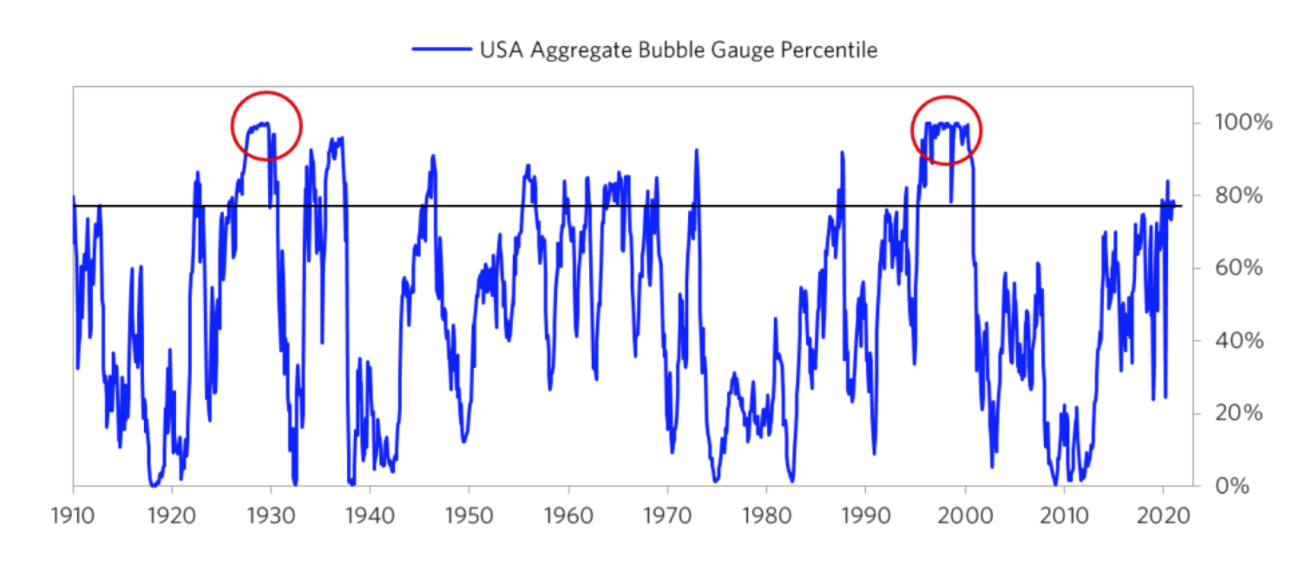
Source: Ray Dalio
Not coincidentally, the S&P 500 12-month forward P/E sits at 22.2, breaching levels also unseen since the dotcom crash. In other words, the U.S. stock market writ large is trading over 22-times its aggregated 12-month forecasted earnings. For reference, the 10-year average hovers around 16-times. As depicted below, the surge of the 12M P/E could be indicative of a bubble formation not unlike 1999-2000.
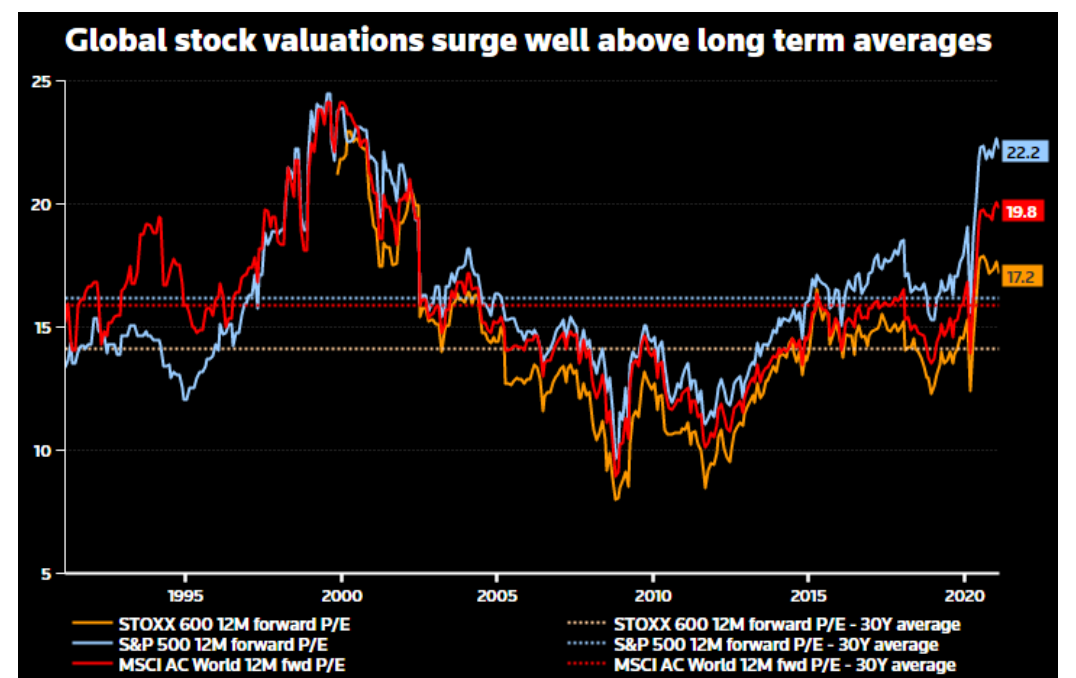
Source: Reuters
Bubbles aren’t necessarily victims of irrational exuberance. It’s hard to argue the irrationality of stock market enthusiasm when viewed against the backdrop of today’s fixed-income assets. A low projected inflation rate (0.62%), a very low federal interest rate (0.08%), and, in turn, extremely weak fixed-income returns on Treasuries and CDs leave little to be desired in fixed-income investments and increases the relative appeal of equities.
.
The Pins That Could Burst A Stock Market Bubble
Bubbles are psychological phenomena, and, as such, they generally follow psychological trends and herding behaviors. If it’s true that we’re in a tech-led stock bubble, there are two trigger events that are most likely to burst the balloon.
Historically, asset bubbles have popped due to any combination of the following factors:
- Inflationary spikes
- Recessions
- Monetary policy errors
- Credit crunch (i.e., a decline in lending activity)
- Liquidity issues
Any of the above catalyzing events can cause investor sentiment to reverse from bullish to bearish, thereby precipitating a sell-off. Right now, we’re staring down two primary threats that could cause the equity asset bubble to burst: inflation and interest rates.
Inflation Risk
Central banks typically have two core objectives in their mandate: to stabilize prices, and to create full employment. If you look at the M2 (i.e., aggregate money supply) against the consumer price index (CPI) and federal interest rates, you’ll notice a trend: spikes in the money supply are usually accompanied by interest rate spikes.
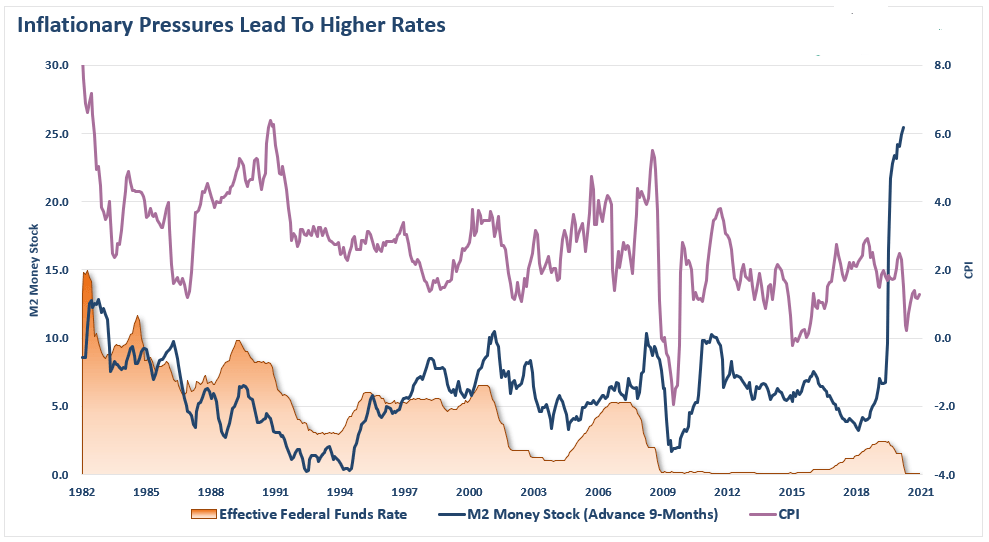
Source: SeekingAlpha
The chart above compares the M2 (9 months advanced) with the federal funds rate and CPI. Historical trends indicate that the Federal Reserve tightens interest rates when the CPI and M2 rise concurrently.
If the trend holds up, we could see the Fed introducing contractionary monetary policy in the near-term, which would have a depressing effect on lending and would slow the velocity of money in circulation. Although Fed officials have indicated that it’s unlikely they will enact interest rate hikes before 2023, sentiment is changing quickly within the central bank as four members (of 18) Federal Open Market Committee are now calling for rate hikes in 2022.
Interest Rate Risk
Market corrections generally follow interest rate spikes, or occur due to their anticipation. If interest rates rise, particularly within a heavily indebted economy, borrowing and spending activity will contract in step. Currently, the U.S. economy has $7.4 trillion in total liabilities versus $39 billion in capital—any changes to federal rates will only tip their balance sheet further into the red and almost certainly flip investor sentiment.
Contrarian analysts have long opined that the stock market bubble doesn’t exist when you consider today’s interest rate environment. Given how cheap it is to borrow, equities aren’t over-valued, so they say, but rationally priced. It follows, then, that a sudden interest rate spike would cast stock valuations in a different light.
The stock market valuation problem is made worse by high rates. As rates elevate, so too do debts on variable-rate credit cards and mortgages. Taken together, an altered interest rate environment would, by design, cool off the entire U.S. economy and would reverse excessively bullish optimism in the equities market.
Is There A 2021 Stock Market Bubble?
As I’ve explained above, there’s strong evidence pointing to asset bubble conditions. Yet, sky-high asset prices aren’t in and of themselves evidence of a bubble. There is, however, an undeniable degree of irrational exuberance in the stock market which, historically, leads to market-wide corrections.
Speculating on the existence of speculative bubbles is a cottage industry unto itself. Truthfully, there’s no foolproof way to make stock market predictions or to determine whether what we’re seeing in the equities market is a bubble. Often, bubble-hunting analysts exist purely to stoke fears. That’s not my aim with this article. Instead, I think it’s more useful to explain what can be done to protect against a potential 2021 stock market bubble, regardless of whether there is one.
How To Protect Against Stock Market Bubbles
Periods of under- or overvaluation can last many years, and fundamental metrics are not always useful indicators of short-run market direction. However, prudent investors would be wise to protect their assets with a “recession-proof portfolio” so they can absorb market shocks no matter when they occur.
A risk-conscious investing diversification strategy is the best defense against uncertainty in the market. Understanding the basic principles of asset allocation can help insulate your wealth from corrections within any one class of assets.
Speak with a financial advisor about diversifying with alternative assets that aren’t correlated to the U.S. equities market, such as precious metals, annuities, real estate, or cryptocurrency. Practicing strategic wealth preservation ensures that market corrections will only affect a small portion of your wealth rather than all of it.
For older investors within 10 years of their target retirement age, consider adopting a low-risk retirement investing strategy with only a minority position in stocks or high-yield ETFs. Holding the majority of your wealth in bonds, alternatives, and cash and cash-like equivalents can help you hang onto more of your money in the event of an economic downturn.
Stock Market Bubble 2021: When Will The Music Stop?
Asset bubbles often feel like a game of musical chairs. When the music eventually stops—as it has, on average, every four years—you don’t want to find yourself without a chair to fall back on. The fallout could delay your retirement by years.
The fact is, no one has a crystal ball. No one knows when the music will stop. There are historically useful signals, such as the inversion of the yield curve (which last happened in February 2020), yet no guaranteed predictors.
This underscores the need to be proactive with diversifying your portfolio. The best thing you can do is financially prepare yourself for disaster so that you’re ready in advance. Diversifying your retirement portfolio with assets non-correlated with the stock market, such as precious metals and other asymmetric investments, might protect your life savings during the next financial crisis.
You can get started by reading our exclusive reviews of the best precious metals companies for your IRA. For deeper diversification benefits, look into our cryptocurrency IRA reviews. By spreading your wealth across alternative asset classes, you can defend your savings against a stock market bubble bursting.
The information provided here is not investment, tax or financial advice. You should consult with a licensed professional for advice concerning your specific situation.
Liam Hunt, M.A., is a financial writer covering global markets, monetary policy, retirement savings, and millennial investing. His commentary and analysis have been featured in the New York Post, Reader's Digest, Fox Business, and Forbes.