Disclosure: Our content isn't financial advice. Do your due diligence and speak to your financial advisor before making any investment decision. We may earn money from products reviewed. (Learn more)

Hedge Fund Portfolio Construction
Portfolio construction shouldn’t be taken lightly and leads to a complex fund selection process. There are many steps to be taken in the Due Diligence needed to filter higher performing managers from their lesser peers. It is well known that past performance does not guarantee future performance. As would seem to be proven in the report by Clifford De Souza and Suleyman Gokcan- 2004 the dispersion in returns of fund managers would seem to show that returns are not persistent. That is to say that an out-performing manager is more likely not to out-perform the successive year. Having said that choosing a top performing Hedge Fund Manager can reap huge benefits; PREQIN reports the top 20 Hedge Fund returns for 2014, the highest return being 225.21%. But there is also another factor that comes into play, the top performing Hedge Funds also tend to be closed to new capital due to strategy capacity constraints. This limits the universe of funds available and given that past performance is not a guarantee of future performance we will look at another way of defining Hedge Fund allocation within the portfolio.
Range of performance
The two tables below show the returns of Mutual and Hedge Fund strategies and their respective ranges and standard deviation. When considering allocations to a portfolio of Mutual funds picking one strategy against another will not particularly generate large differences in return. The range for the 3 year average return is on 2.18% and standard deviation is 0.79%. Meaning that however you chose to allocate across strategies you would not be able to improve return by more than a few percentage points.
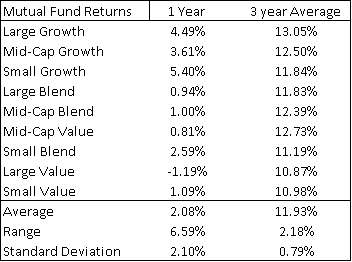
Authors calculations using data from Morning Star and Hedgeindex.com
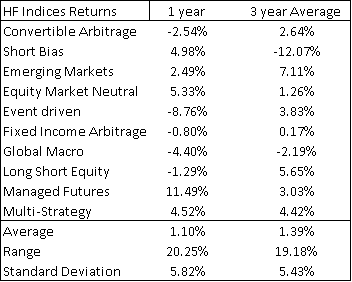
Looking at the table for Hedge Fund returns by strategy we see that the difference between highest and lowest returns is 19.18% for the 3 year average, and standard deviation is 5.43%. It would seem clearly more possible to increase portfolio performance by allocating to the best performing strategies.
Definitely there is a considerable difference when investing between strategies with the highest and lowest returns.
Creating Hedge Fund Portfolios of the 4 Top and Worst performing Strategies over the past 3 years would have given an average portfolio return of 5.25% against -3.21%. In the Mutual Fund space the Top and Worst portfolios of 4 strategies would give a return of 12.67% and 11.22%. The difference between best and worst portfolio in Mutual Funds is 1.45% whereas the difference between best and worse Hedge Fund Portfolio is 8.46%, nearly 6 times more than the passive investment strategy portfolios.
There is still a lot of work to do in choosing the right manager once you have outlined which strategies are going to be included in your Hedge Fund portfolio. The tables below show the top 20 Mutual funds for large Blend and the best 20 Hedge Funds all strategies for performance. The tables are ranked in order of 3 year return for the Mutual Funds and 2014 return for Hedge Funds. The top 20 Large Blend funds have a range of 1.16%. The top 20 Hedge Funds have a range of 39.12%. That is nearly 30 times the Mutual Fund range despite excluding the highest return for Hedge Funds as it should be considered an outlier.

Source Morning Star
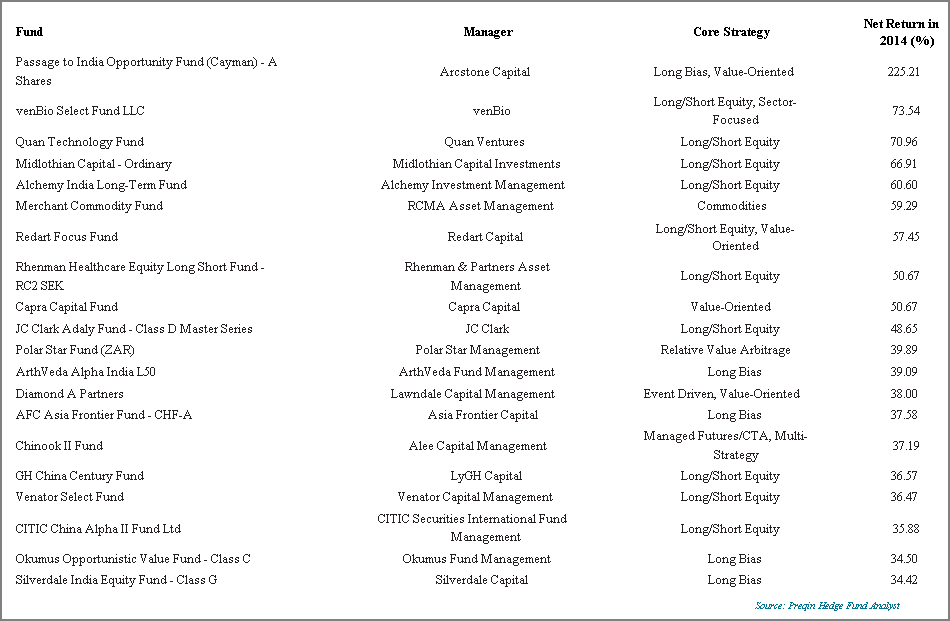
Source Preqin
It is easy to see how much more important it is to pick the best mangers in Hedge Funds when making investment choices compared to picking Mutual Fund managers. However a well-diversified Hedge Fund portfolio across the strategies is most likely to also be profitable when thinking forward. It is also very likely to offer high diversification potential as well as limit maximum drawdowns in times of crisis.
Things to Consider When Allocating to Strategies
It is important to analyse the global macro picture in relation to the different strategies adopted by Hedge funds. How does the particular strategy fit into the current narrative and how will it most likely perform as we move forward and into the next regime.
We may be headed into a Bear market given the recent macro-economic events and broad stock price action. This type of regime would call for a higher allocation to Short Bias strategies.
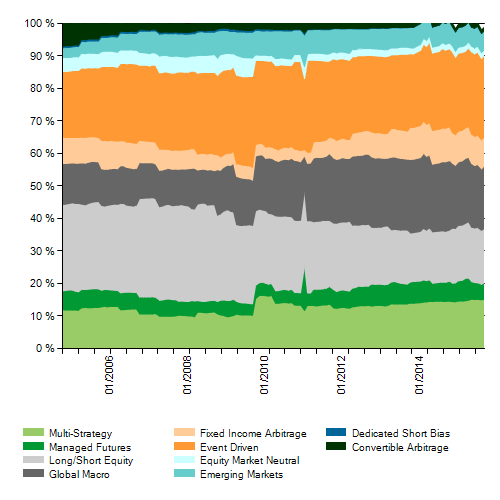
Source Hedgeindex.com
There may also be a higher interest rate scenario taking place over the next year leading to higher interest rates in all Fixed Income products. Fixed Income arbitrage strategies should favor from such an environment as it is easier to have larger differences in value when yields are higher across the board. From the chart above we can see how this strategy has been gaining ground over the past 3 years.
Managed Futures have shown to have low maximum drawdowns and given their low correlation to stocks are likely to offer very high diversification potential while helping in protecting against downside shocks. CTAs gained 14.09% in 2008 when all broad stock indices suffered incredibly large losses as the crisis set in. What sets this asset class aside from other Hedge Fund strategies is the fact the it does not trade in Stocks and Bonds. It is not surprising then that correlation, calculated from 1994, to S&P 500 for this strategy is -0.07.
Gino D'Alessio is a Broker/Dealer with over twenty years experience in various OTC markets such as Bonds, FX and Derivatives. Currently a Financial Markets and Investments Writer & Analyst