Disclosure: Our content isn't financial advice. Do your due diligence and speak to your financial advisor before making any investment decision. We may earn money from products reviewed. (Learn more)
Benchmarking an investment is a necessary procedure to analyze the performance of a manager compared to his peers or an index if it is a fund with a buy and hold strategy. It allows you to identify a manager’s performance compared to other managers, which is part of the due diligence process in manager selection. It also allows you to monitor and track a manager once the allocation has been made. Benchmarking in Private Equity therefore is just as important as it is with traditional investments, even though it may not be as straight forward.
Tracking active management
Traditional funds have long only strategies, that is to say they are passive management investments. Private Equity on the other hand involves active management, as the manager is not trying to track an index, but he is rather trying to identify outperforming investment opportunities. This is why P.E. investments are often known as Absolute Return investments. Usually absolute return investments are benchmarked to a minimum required rate of return, which can be a fixed percentage or a spread over another return for example; 3% over the Russell 3000 index. This type of benchmark is valuable in absolute terms but it does not tell us how well the manager performed compared to his industry.
Return measures
Return in P.E. is not measured on the same basis as Public Equity which is measured on a time weighted basis, i.e. 5% per annum. Due to the irregular cash flow profile in P.E. you may have capital outflows during the initial years of the fund to then wait various years before seeing any cash inflows. This means that a dollar weighted measure is more appropriate as the time weighted measure of return becomes problematic when trying to incorporate such irregular cash flows.
This brings out the problem that the P.E. return for the fund will be dollar weighted whilst the index return will be time weighted. This is like trying to compare Apples to Pears, yes both are fruits, grow on trees and can be eaten, yet they are substantially different. Internal Rate of Return (IRR) is the most commonly used, but you may also find some use a Modified Internal Rate of Return or Multiples. The IRR implies that cash inflows are reinvested at the IRR, whereas the Modified IRR takes into account the cost of capital and the reinvestment rate. Multiples measure the ratio of capital outflows to paid-in (invested) capital, so if you invest $100 and receive $200 your multiple is 2. Of course this measure like the IRR does not take into consideration time, so you may have a multiple of 2 but it may have taken 10 years to receive that capital.
Using Public Market Equivalent (PME) to compare Apples to Apples
More recently over the past decade a way to enable benchmarking P.E. to a Public Equity index on a like for like basis has been developed. The PME allows you to measure a P.E performance by attributing a long position in the benchmark index for each capital outflow and a short position for each capital inflow. What this does is assume that the capital invested and distributed was done so at the value of the index. Now this will give you a return based on investments and divestments using the benchmark index as a quantifier of value. So now you can compare the performance of a P.E. to that of a benchmark.
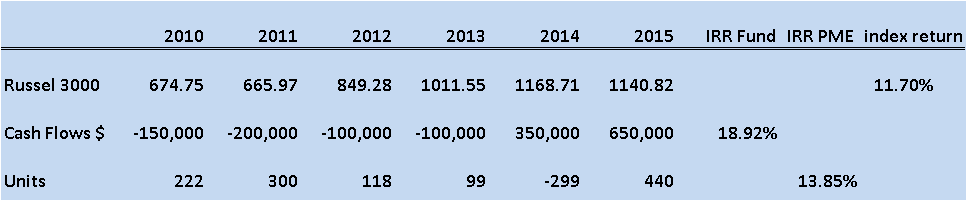
The exhibit above shows how this works, the Cash Flows indicate those of a hypothetical P.E. fund, taking those you now calculate how many units of public equity equivalent you would have bought or sold.
Negative cash flows are considered as buying the index so they show as positive units. The cash flows for the fund and the index are all the same except for the last value. The final value for the PME is calculated by taking the number of units cumulated and multiplying by the index value. In 2015 this series of investments and divestments would have left you with 440 units at a value of 1140.82 per unit, giving a total value of $501,673.
Typing the cash flows into a calculator would give you an IRR of 18.92% for the fund. This is an extremely large outperformance to the index which averaged 11.70%. However by comparing the fund’s performance to the PME, which had a return of 13.85%, we see that the outperformance is slightly smaller.
Defining a Benchmark amongst peers
Whilst for traditional investments defining a benchmark is comparatively easy, a Mutual Fund investing in large cap US would be easily identified as tracking the S&P 500. This clear association in the P.E. world does not exist. It is necessary to create a peer group of P.E. funds that are preferably very similar to the fund being benchmarked. There various index vendors such as Cambridge Associates or Preqin. It’s a good idea to use a peer group of funds that have the same vintage year (year of inception) specialize in the same industry sector and geographical area. Mutual funds are long only investments so they mimic an index extremely easily. The underlying index is also investable; in the P.E. space a peer group may not be completely investable.
Trying to create a peer group let’s say for a2001 North America health care/biotechnology industry you may find that there are few funds to add together to create a benchmark. The best thing to do is widen the vintage year to include say 1999 to 2003, as these funds will still have a good many years of results in common with the fund being benchmarked.
Gino D'Alessio is a Broker/Dealer with over twenty years experience in various OTC markets such as Bonds, FX and Derivatives. Currently a Financial Markets and Investments Writer & Analyst